About pixy
pixy is a command-line tool that computes π, dxy, FST,
Watterson's θ, and Tajima's D from a VCF. Unlike most tools that compute
these statistics, pixy produces unbiased estimates in the presence
of missing data.
In more detail: pixy is a command-line tool for painlessly and correctly
estimating population genetic summary statistics that measure genetic
variation within populations (π, θW, Tajima's D) and between
populations (dxy, FST) from a VCF. In particular, pixy
facilitates the use of VCFs containing invariant (AKA monomorphic) sites,
which are essential for the correct computation of π and dxy
whenever data are missing.
pixy avoids common pitfalls in computing pi and dxy
Population geneticists are often interested in quantifying nucleotide diversity within and nucleotide differences between populations. The two most common summary statistics for these quantities were described by Nei and Li (1979), who discuss summarizing variation in the case of two populations (denoted 'x' and 'y'):
π — average nucleotide diversity within populations, also sometimes denoted πx and πy to indicate the population of interest.
dxy — average nucleotide difference between populations, sometimes denoted πxy (pixy, get it?), to indicate that the statistic is a comparison between populations x and y.
Many modern genomics tools calculate π and dxy from data encoded
as VCFs, which by design often omit invariant sites. With variants-only
VCFs, there is often no way to distinguish missing sites from invariant
sites. The schematic below illustrates this problem and how pixy avoids
it.
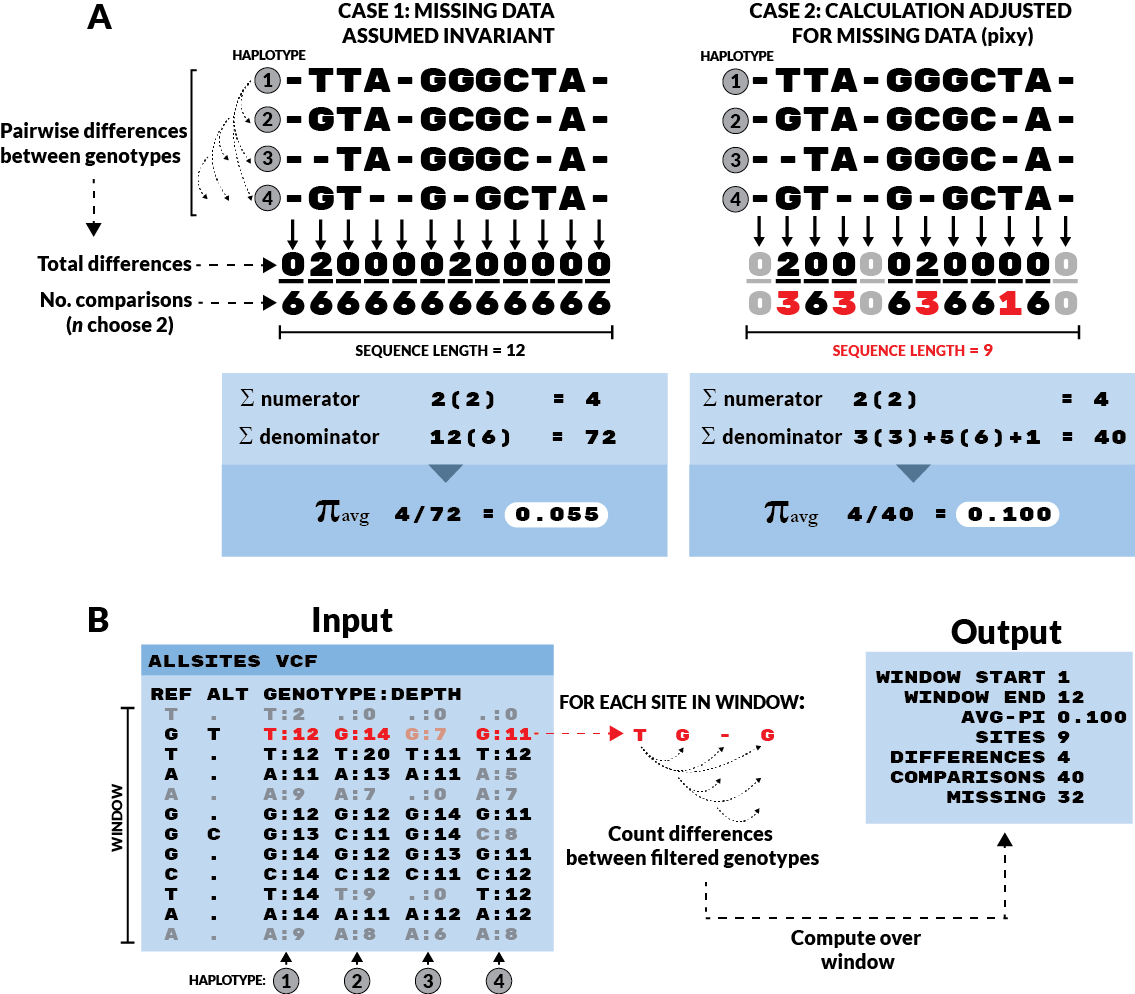
Figure 1 from Korunes & Samuk 2021.
In Case 1, all missing data is assumed to be present but invariant. This
results in a deflated estimate of π. In Case 2, missing data are simply
omitted from the calculation, both in terms of the number of sites (the
final denominator) and the component denominators for each site (the
n choose 2 terms). This results in an unbiased estimate of π. The
adjusted π method (Case 2) is implemented for VCFs in pixy. Invariant
sites are represented as sites with no ALT allele, and greyed-out
sites are those that failed to pass a genotype filter requiring a minimum
number of reads covering the site (Depth ≥ 10 in this case).
The same logic applies to the new unbiased estimators of Watterson's θ and
Tajima's D introduced in pixy 2.0. See Bailey, Stevison & Samuk (2025)
for the derivation and a simulation-based assessment of the bias incurred
by ignoring missing data when computing these statistics.
Notable features of pixy
Fast and efficient handling of invariant-sites VCFs.
Computation of π, dxy, FST, Watterson's θ, and Tajima's D for arbitrary numbers of populations.
All statistics are computed in arbitrarily sized windows, and the output contains the raw counts (numerators and denominators) used in every computation — making post-hoc aggregation across windows straightforward and statistically correct.
As of
pixy 2.0: support for organisms of arbitrary and variable ploidy (including sex chromosomes and organellar contigs in the same VCF), multiallelic sites, and both.tbiand.csiVCF indexes. Per-contig ploidy is detected automatically — no need to split VCFs by ploidy.Two FST estimators available: Weir & Cockerham (1984) and Hudson (1992) / Bhatia et al. (2013). Only Hudson's estimator supports non-diploid data; WC FST is skipped on non-diploid contigs with a warning.
Heavy use of the data structures and routines from the excellent scikit-allel library.